IDEA | An International Comparison of Economic and Academic Performance of OECD Countries

An International Comparison of Economic and Academic Performance of OECD Countries

Web tool inspired by a study by Jurajda et al. (2017)

Taras Hrendash, Štěpán Jurajda, Stanislav Kozubek, Daniel Münich

IDEA, Think-tank of the Economics Institute of the Czech Academy of Sciences

September 2018


About the application

  • We aim to help raise discipline-specific questions rather than to answer them.
  • The application does not aspire to identify causal links. The patterns shown should be understood as mere associations.

How it works

Set the menu

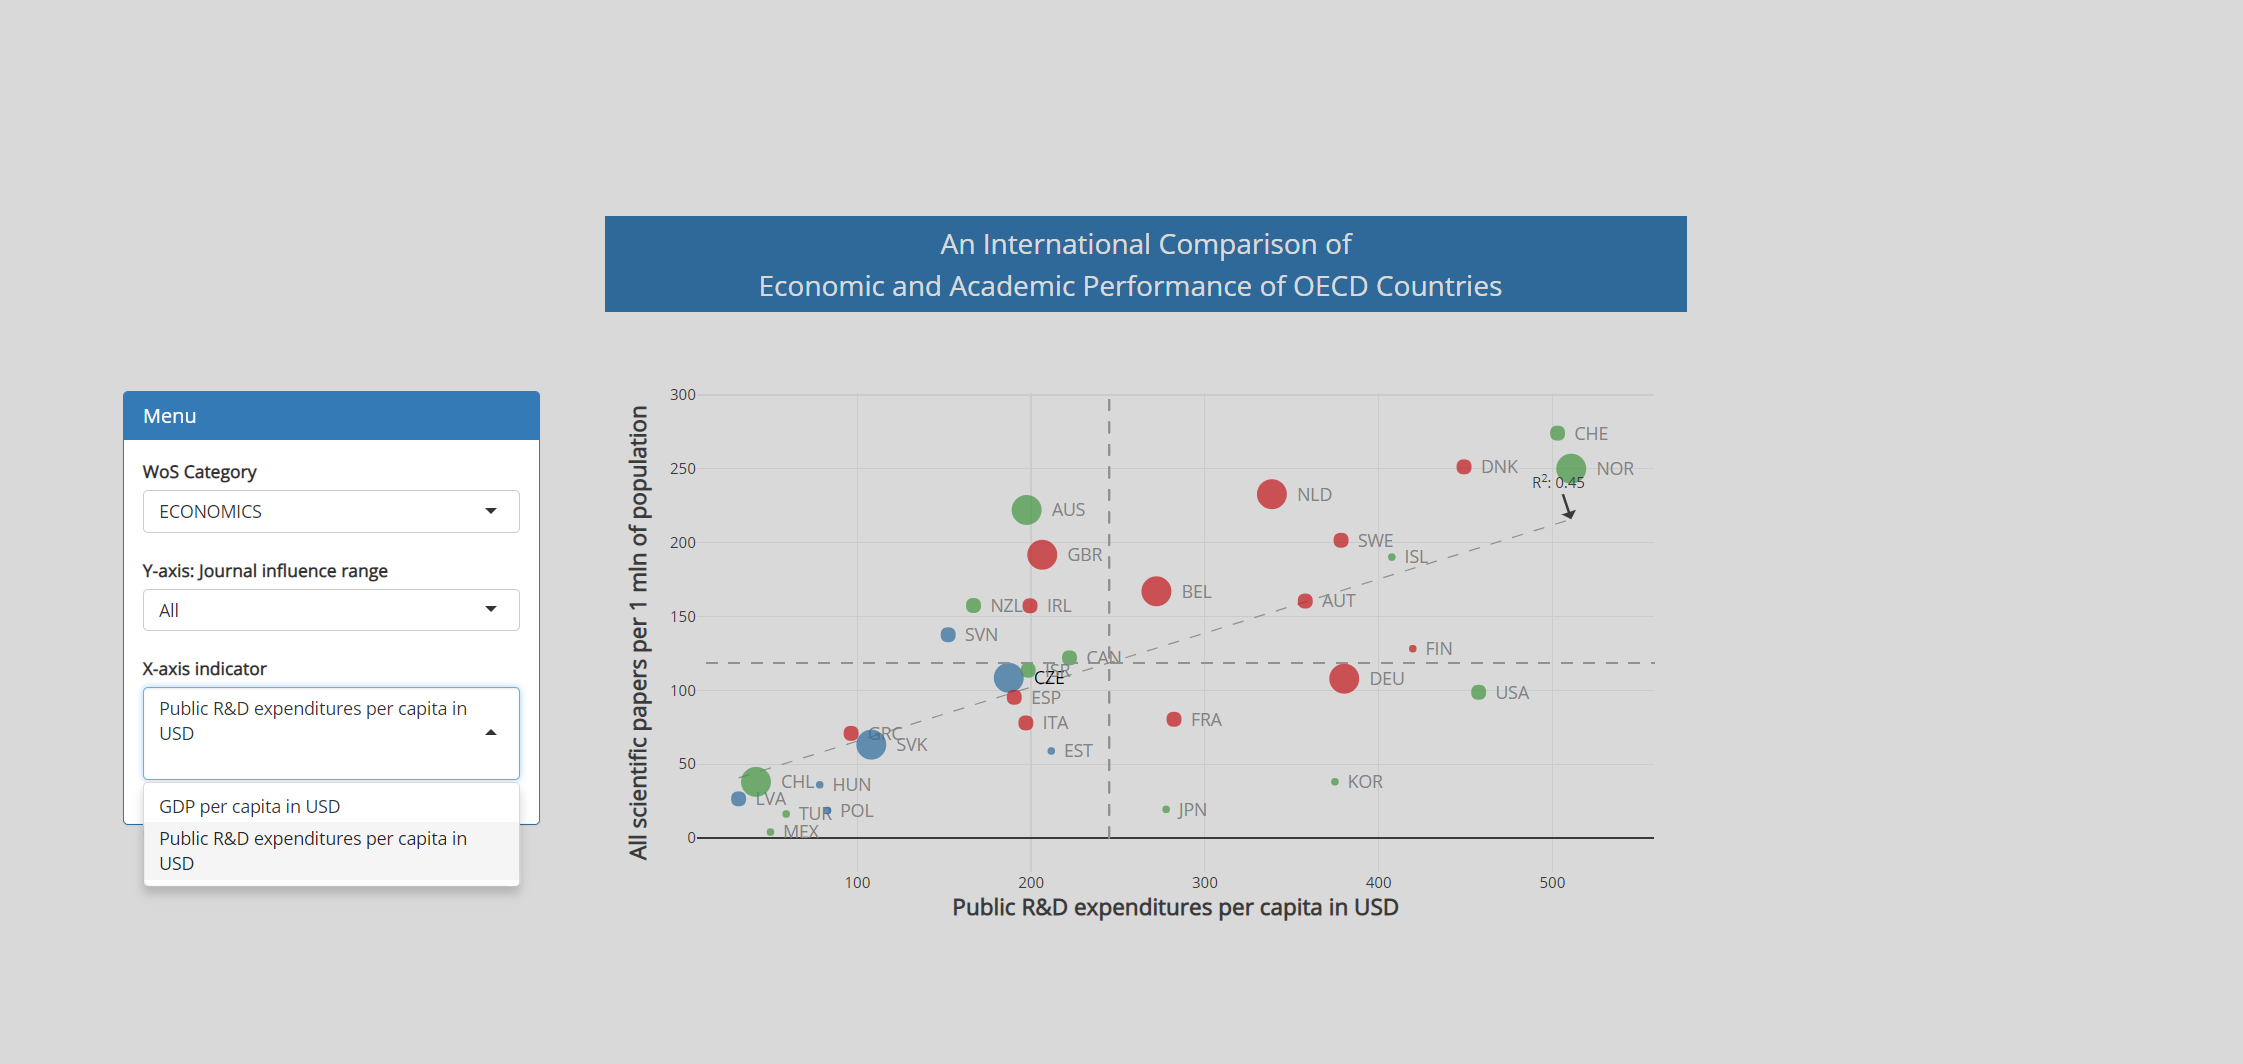
Choose what you want to display in the graph:

Choose countries to display

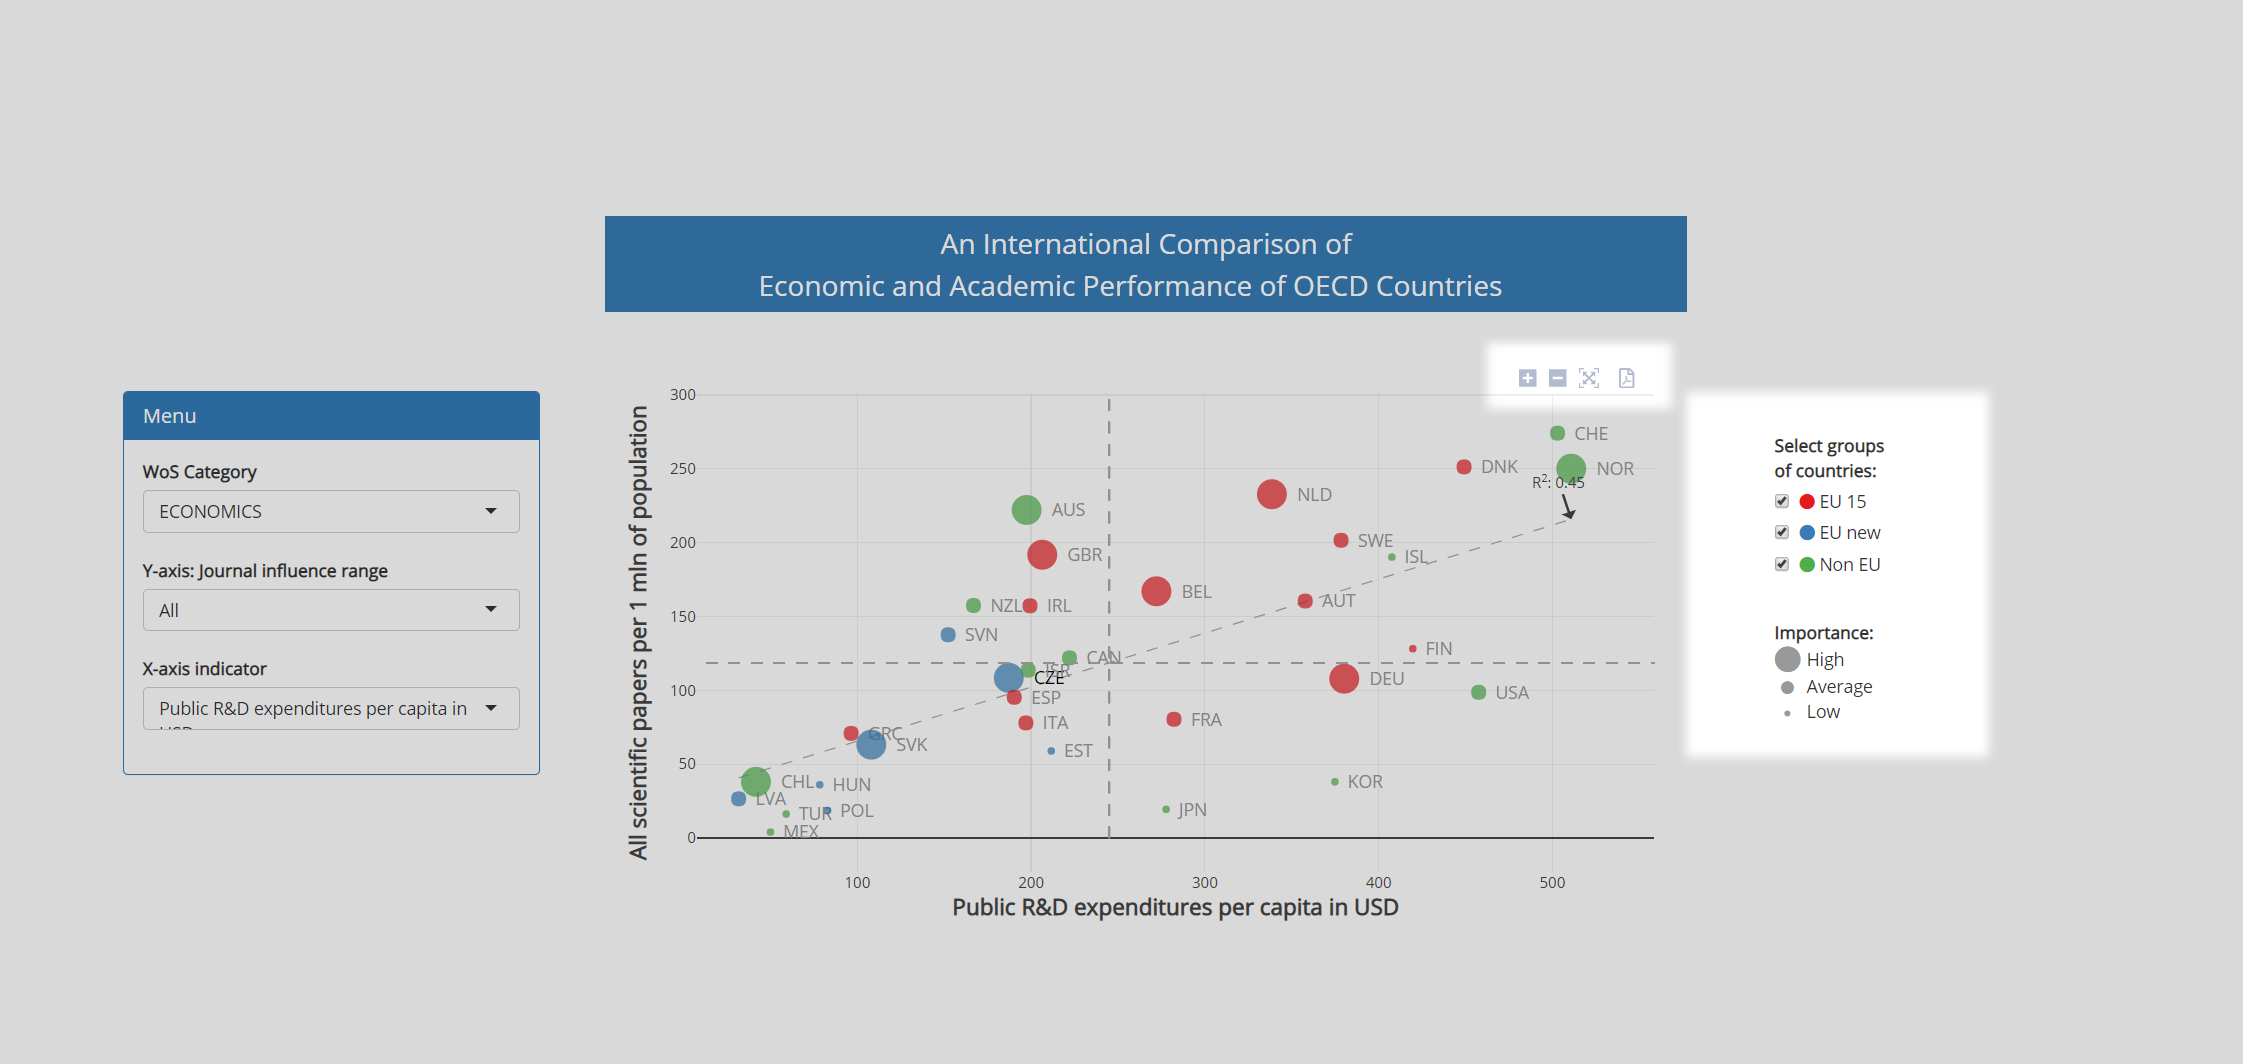
The color of country data points distinguishes three types of OECD countries. By clicking on the legend, one can eliminate specific types from the plot.

Data point size corresponds to the share of a particular discipline within a country on total output.

TIP: It is possible to zoom in on any sub-area of each graph (by highlighting the chosen area) and to create PDFs for print.

Example: Economics

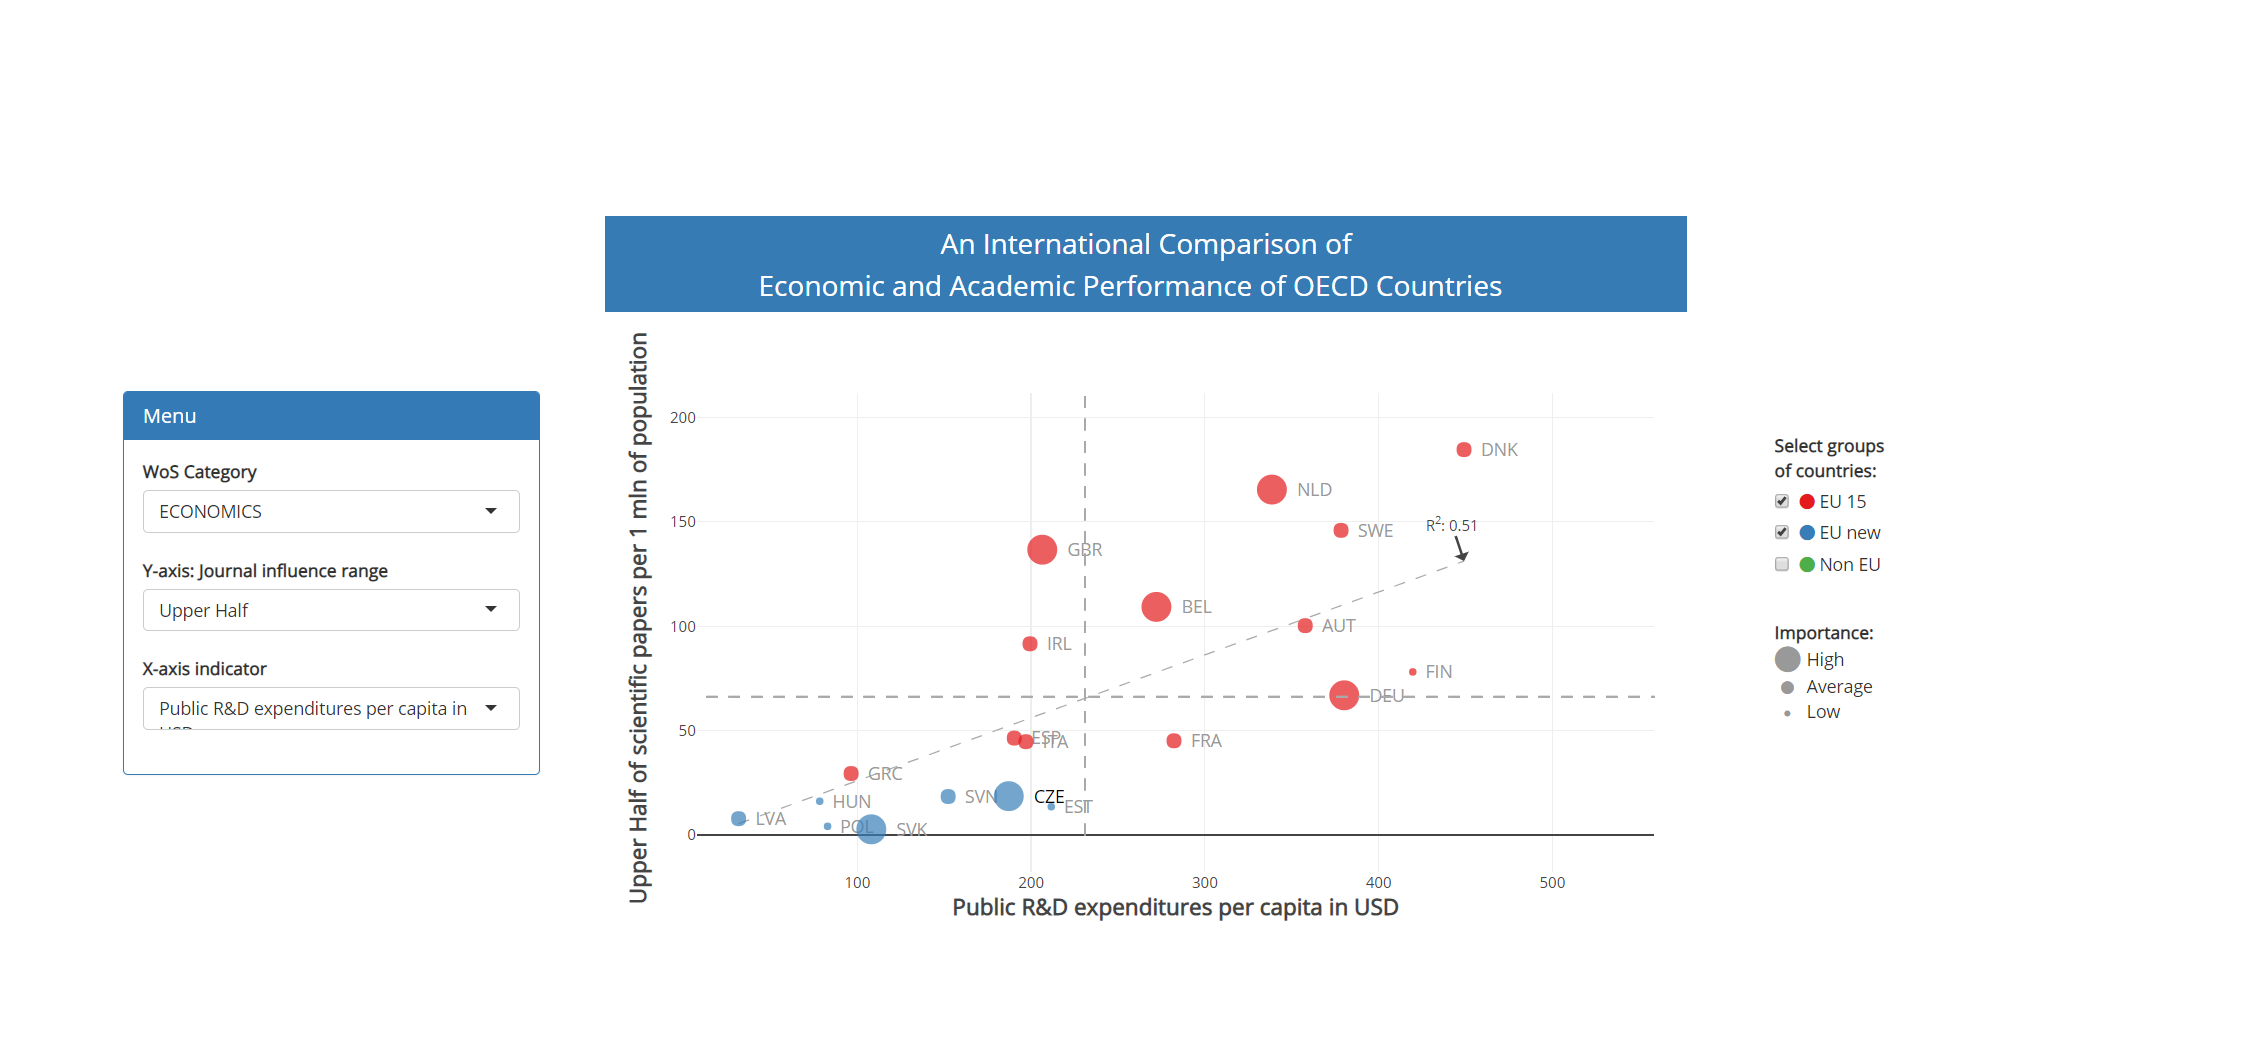
Example Graph #1

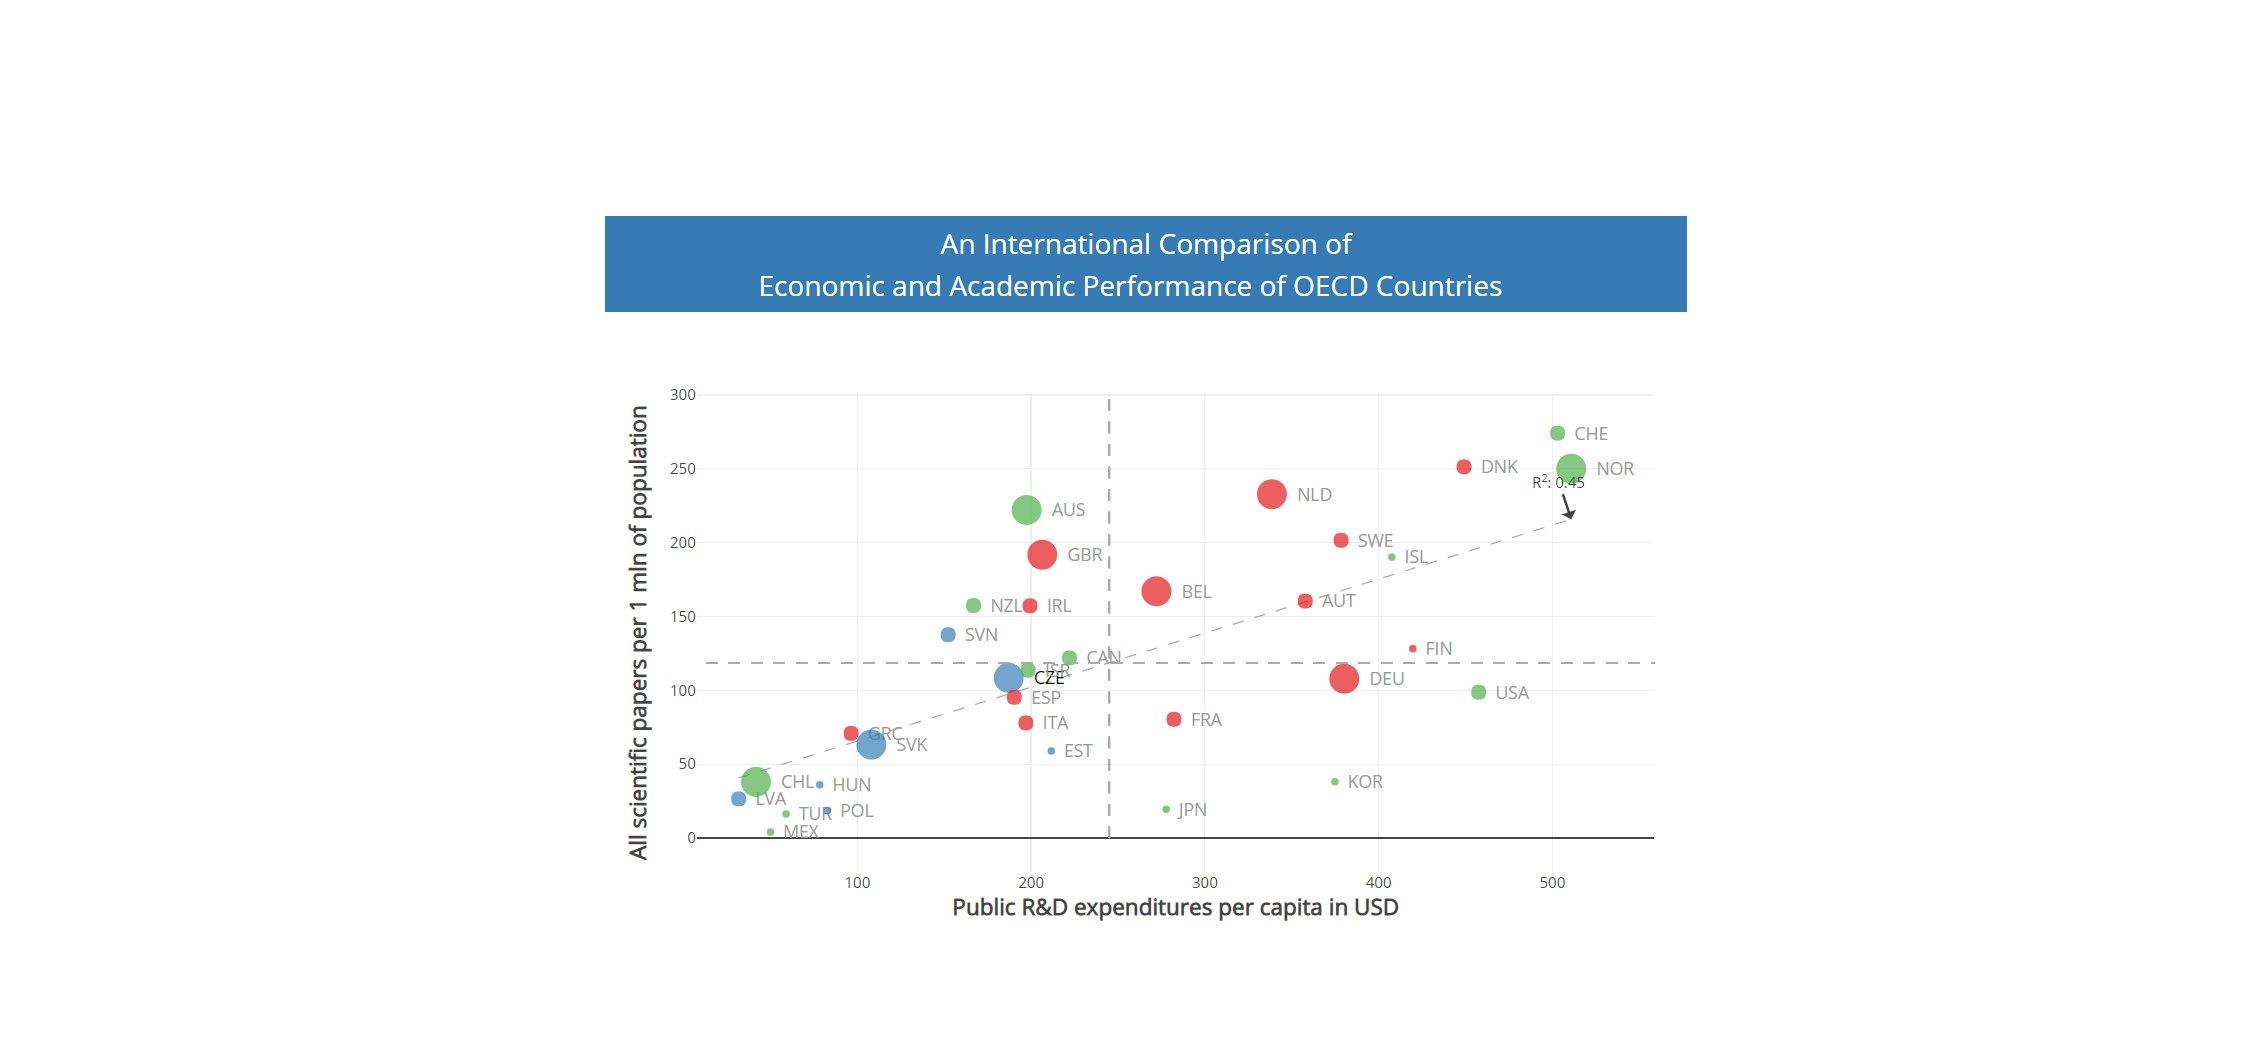
Graph #1 shows the relationship between the economic performance of countries and their publication performance in the field Economics for the upper half of journals by their influence.

The graph reveals that the UK, the Netherlands, and Denmark produce unusually high volumes of articles per millions of population in highly influential journals relative to their R&D public expenditures per capita.

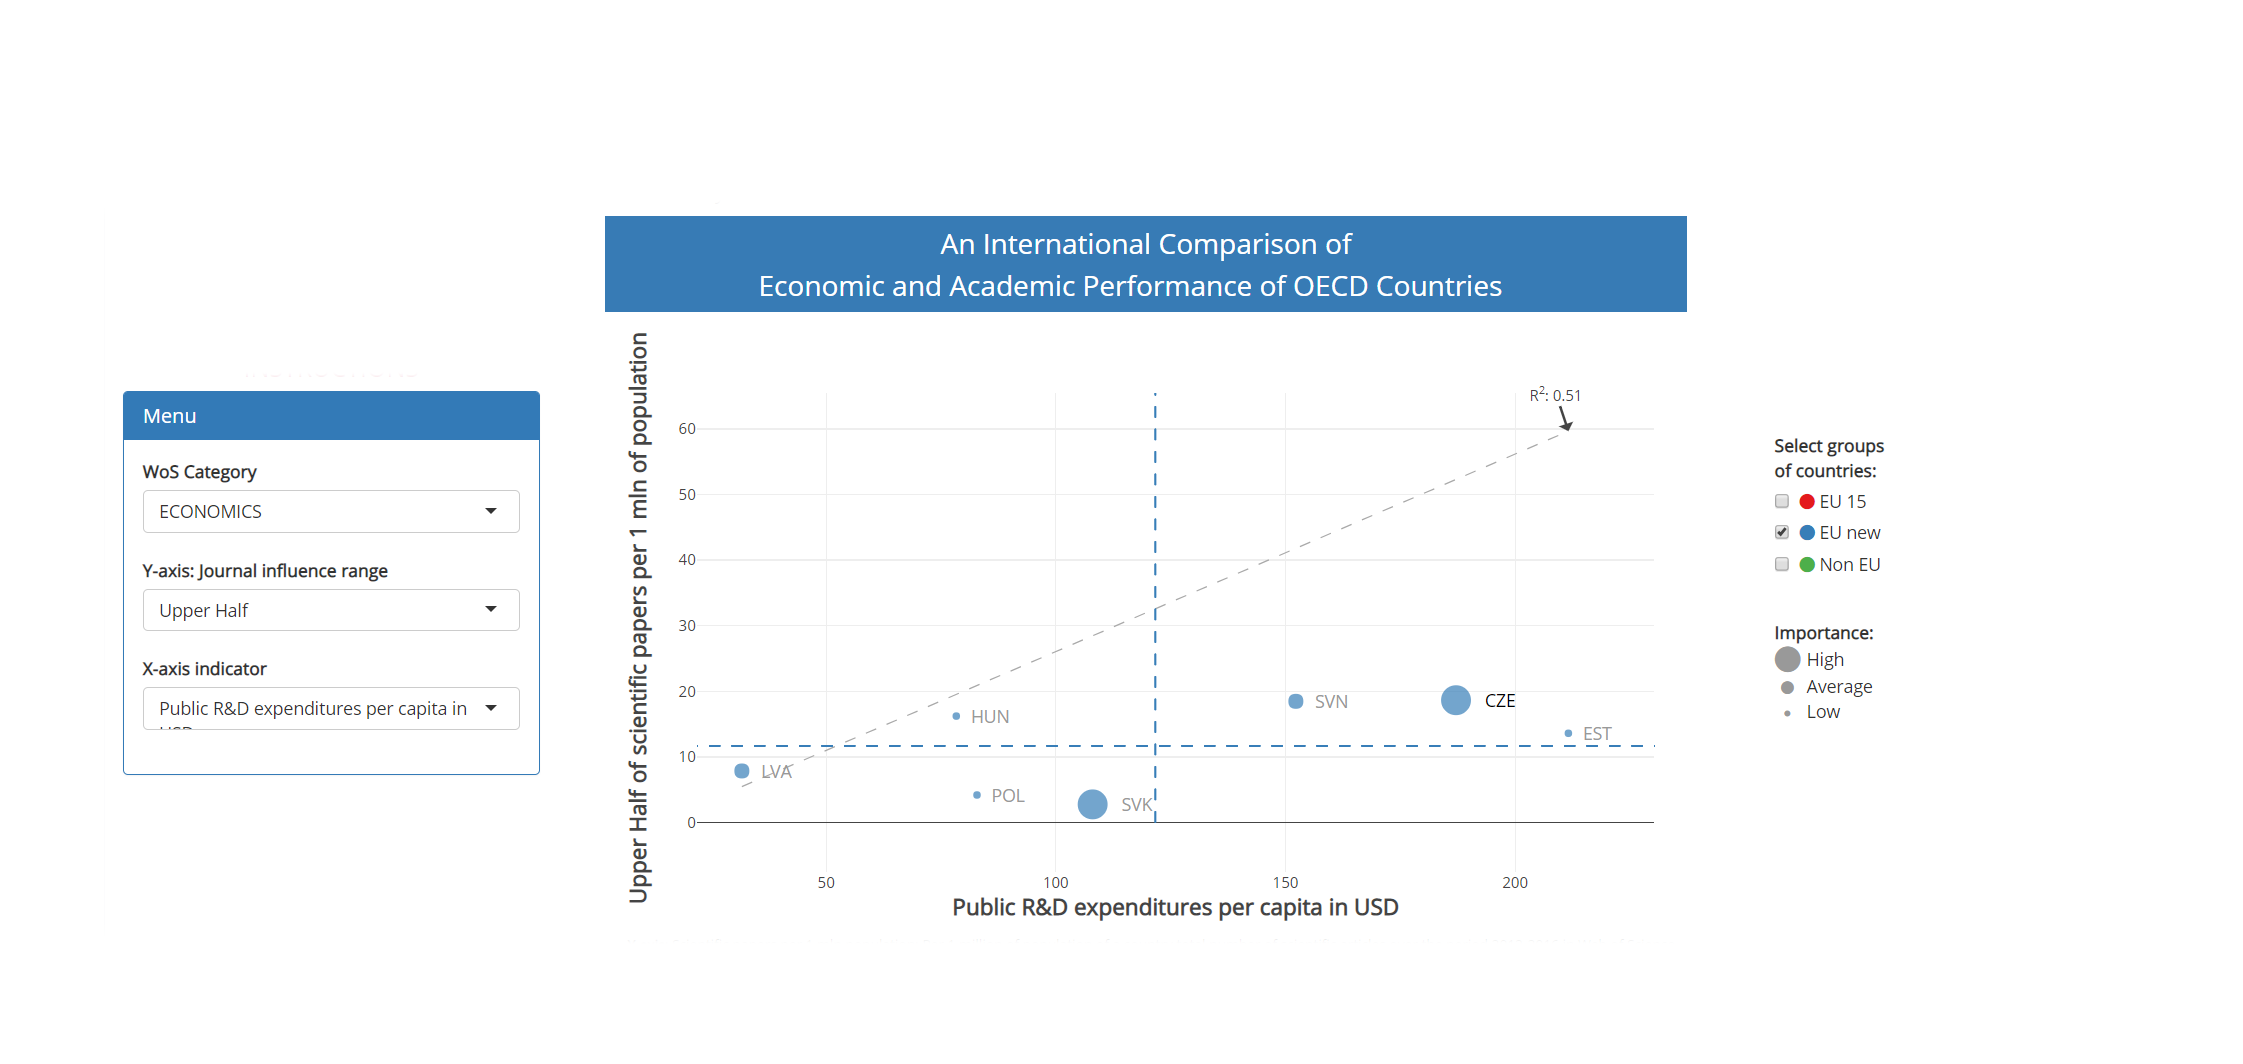
Example Graph #2

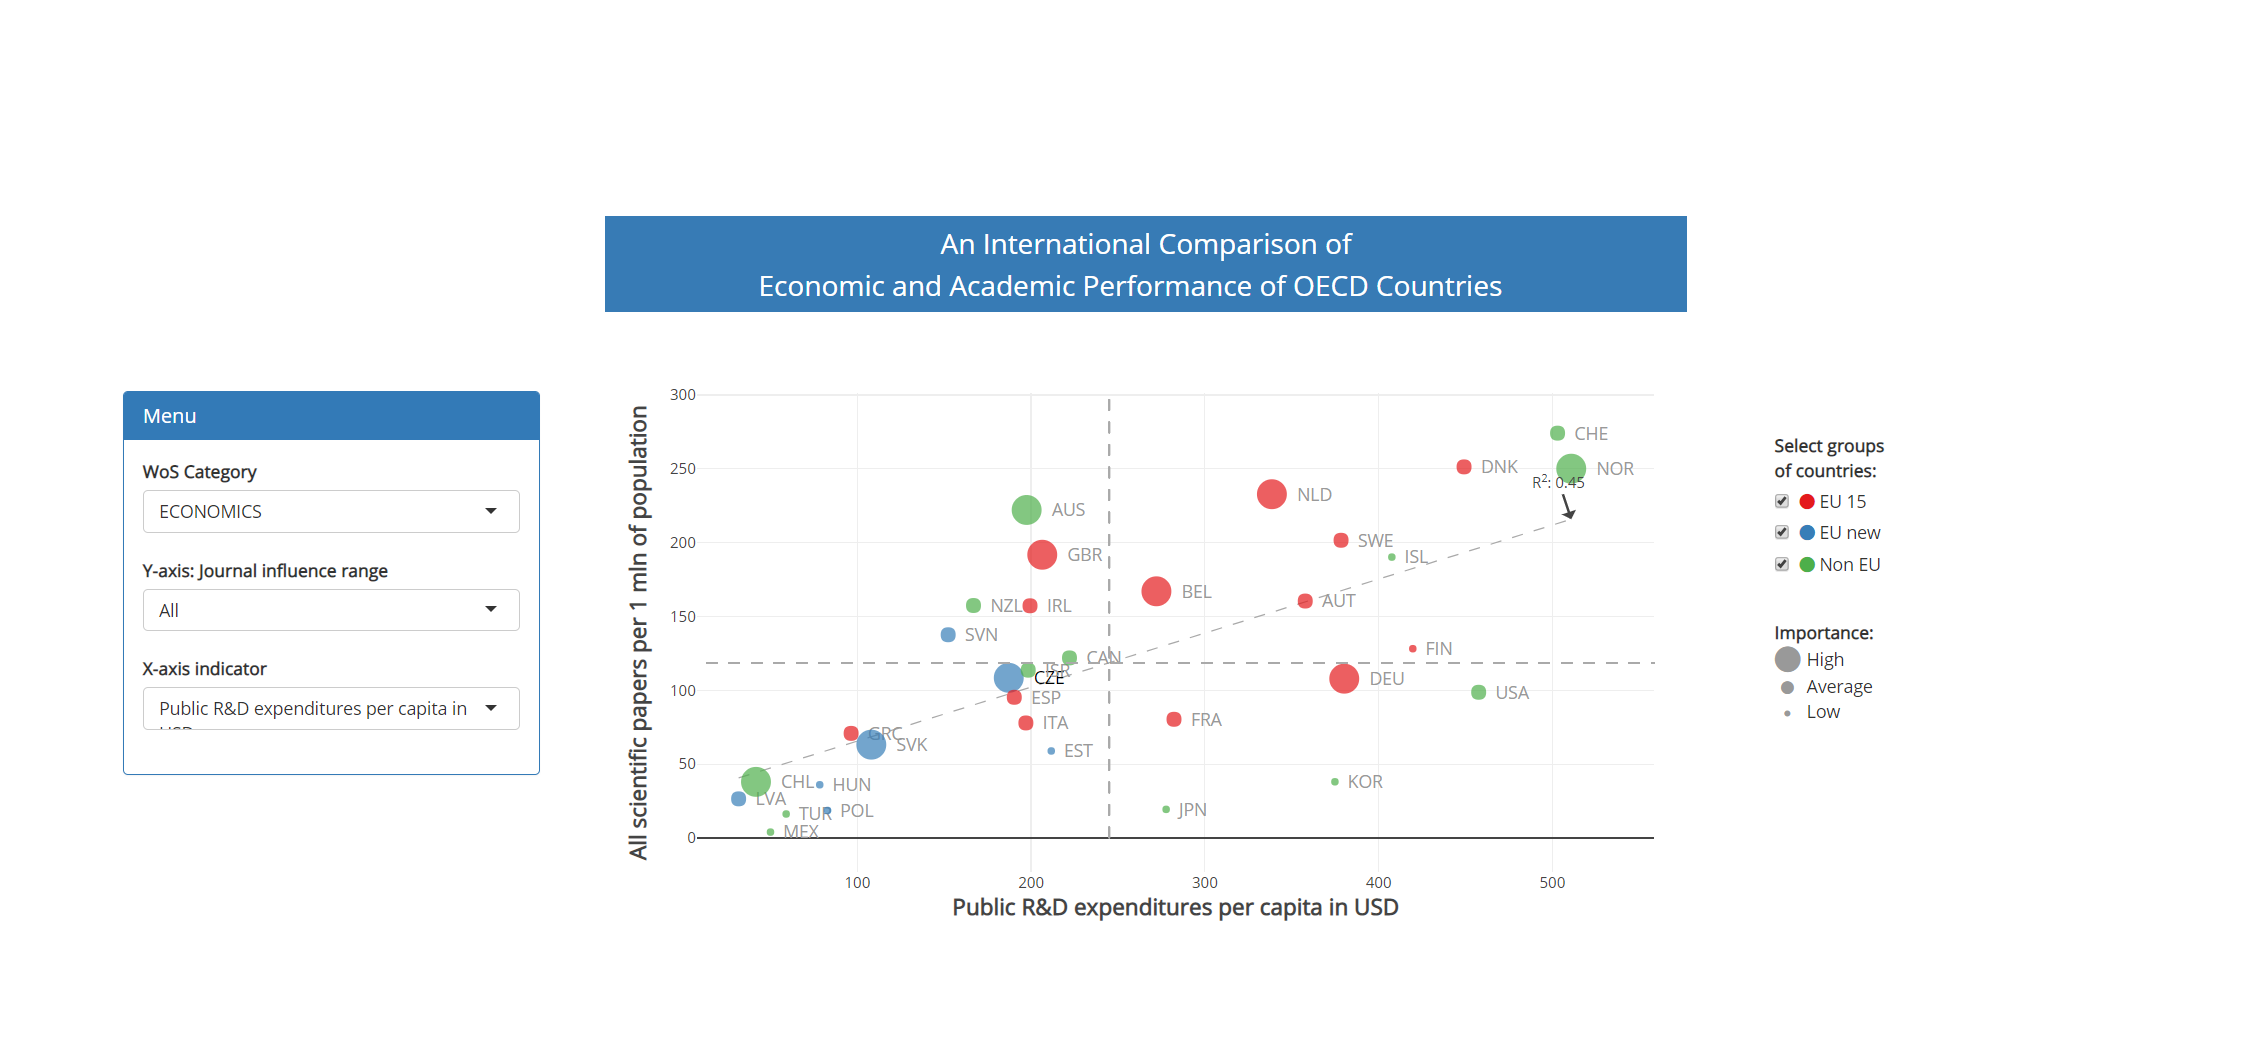
In contrast, all of the new EU members fall below the fitted regression line, suggesting that they perform below the level corresponding to their economic might.

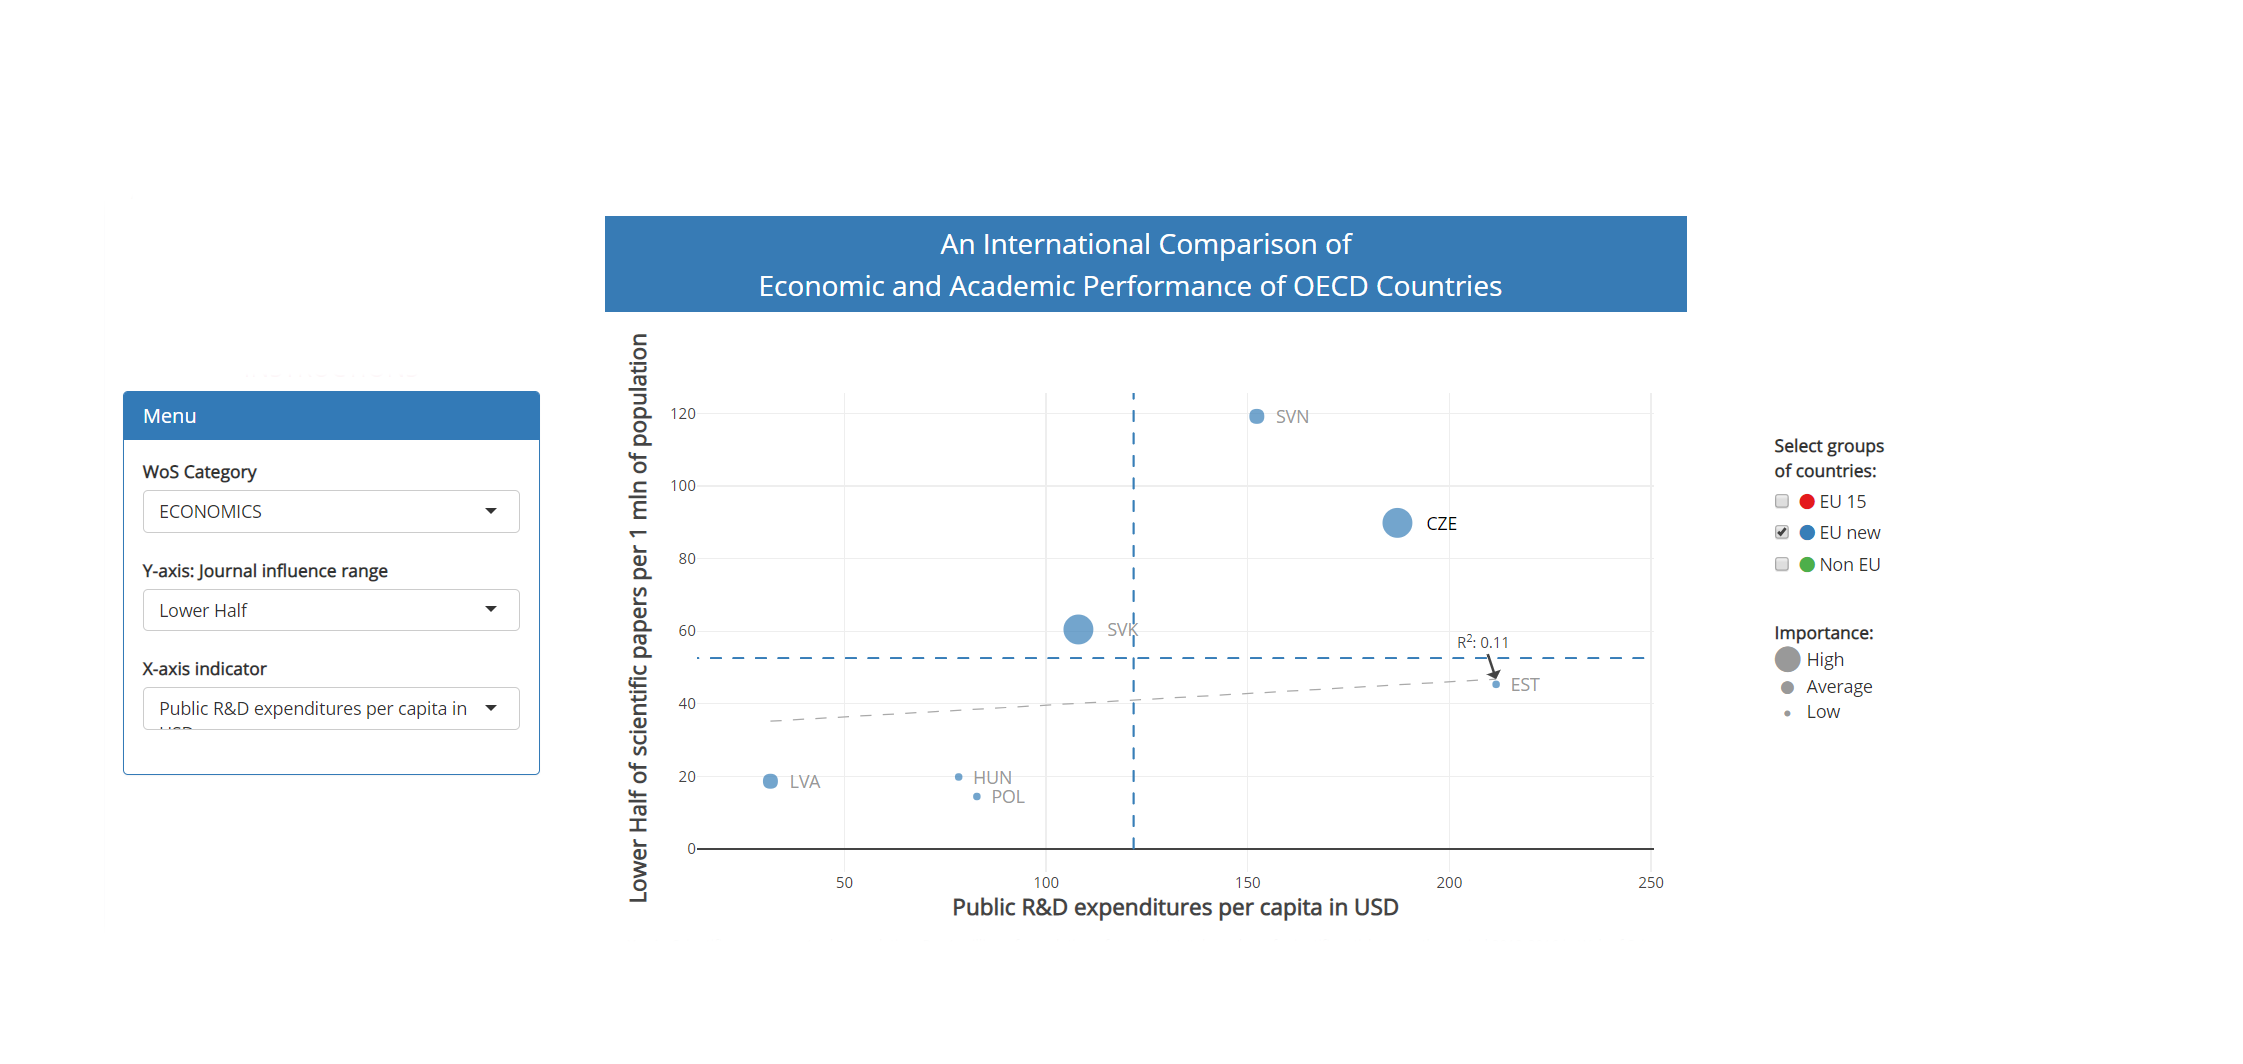
Example Graph #3

Furthermore, some of the new EU members (the Czech Republic and Slovenia in particular) appear to produce unusual volume of research output in Economics in low-influence journals.

This website was created by Paulína Očkajová and Vít Macháček.